Guides, market digests and plain-language lessons on crypto, forex and gold.
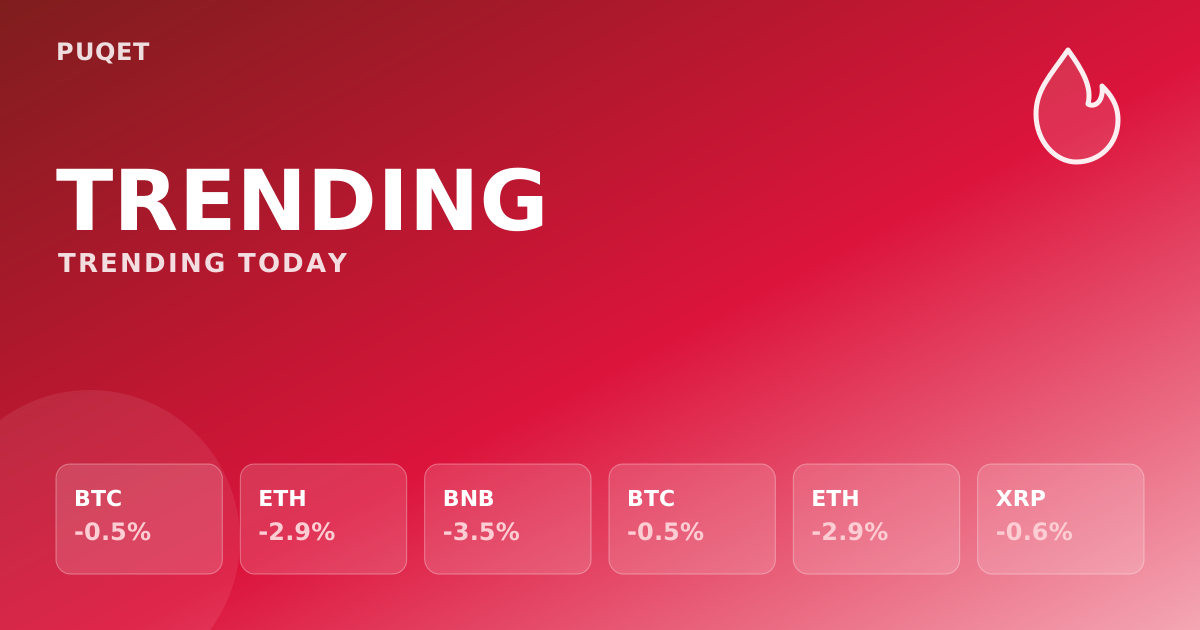
The coins getting the most attention today — hot picks and volume leaders.
2026-10-10
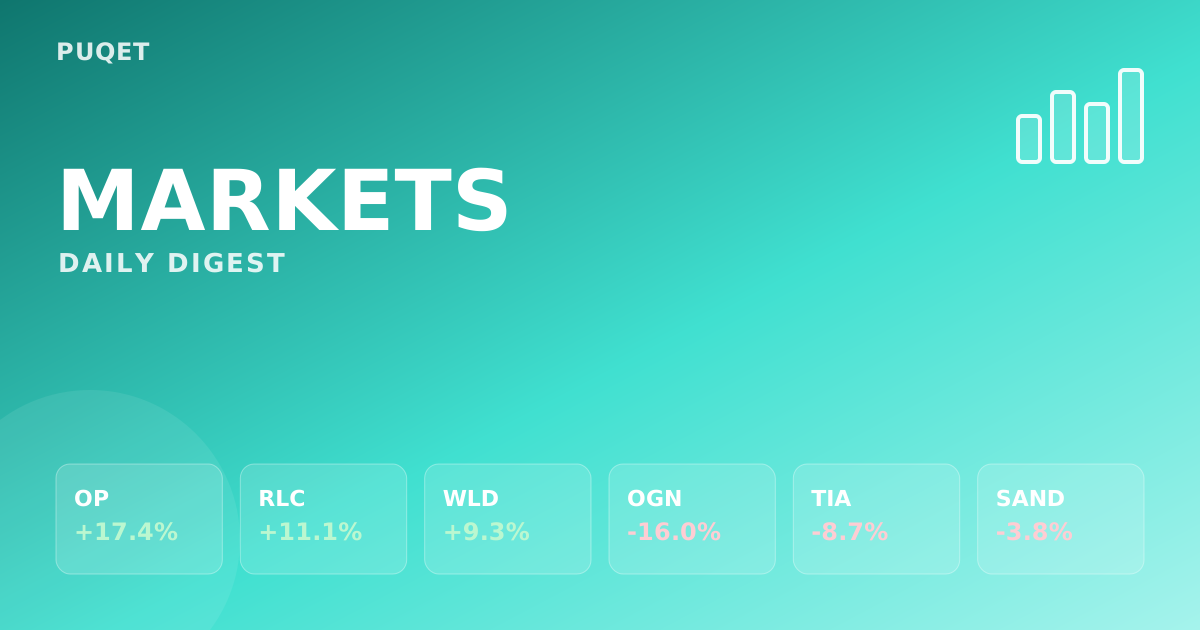
OP leads today's movers — see the full gainers and losers breakdown.
A quick overview of Stellar (XLM): current price, market cap rank, and supply data as of October 10, 2026.
A quick overview of Hedera Hashgraph (HBAR): current price, market cap rank, and supply data as of October 10, 2026.
A quick overview of bittensor (TAO): current price, market cap rank, and supply data as of October 10, 2026.
A quick overview of Ondo (ONDO): current price, market cap rank, and supply data as of October 10, 2026.
A quick overview of Artificial Superintelligence Alliance (FET): current price, market cap rank, and supply data as of October 10, 2026.
A quick overview of Algorand (ALGO): current price, market cap rank, and supply data as of October 10, 2026.
A quick overview of Celestia (TIA): current price, market cap rank, and supply data as of October 10, 2026.
A quick overview of Zcash (ZEC): current price, market cap rank, and supply data as of October 10, 2026.
A quick overview of Origin Protocol (OGN): current price, market cap rank, and supply data as of October 10, 2026.
A quick overview of iExec RLC (RLC): current price, market cap rank, and supply data as of October 10, 2026.
RSI is a momentum indicator that measures how strong recent price gains are compared with recent losses, condensing that comparison into a single number between 0 and 100. Here's how it's calculated, what traders read into it, and where it breaks down.
Forex runs around the clock on weekdays, but activity isn't spread evenly. Here's how the Sydney, Tokyo, London and New York sessions overlap, why liquidity rises and falls, and what that means for spreads and volatility — including gold.
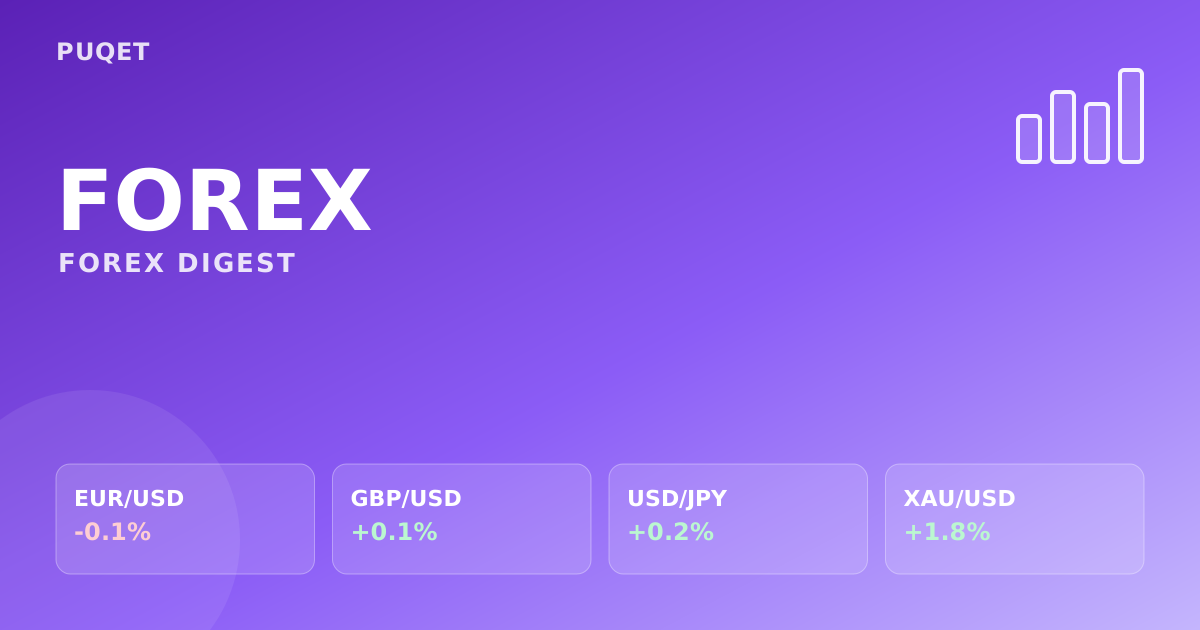
XAU/USD was the biggest mover over the last 24 hourly candles (+1.79%) — last price, change and range for each pair.
2026-10-09
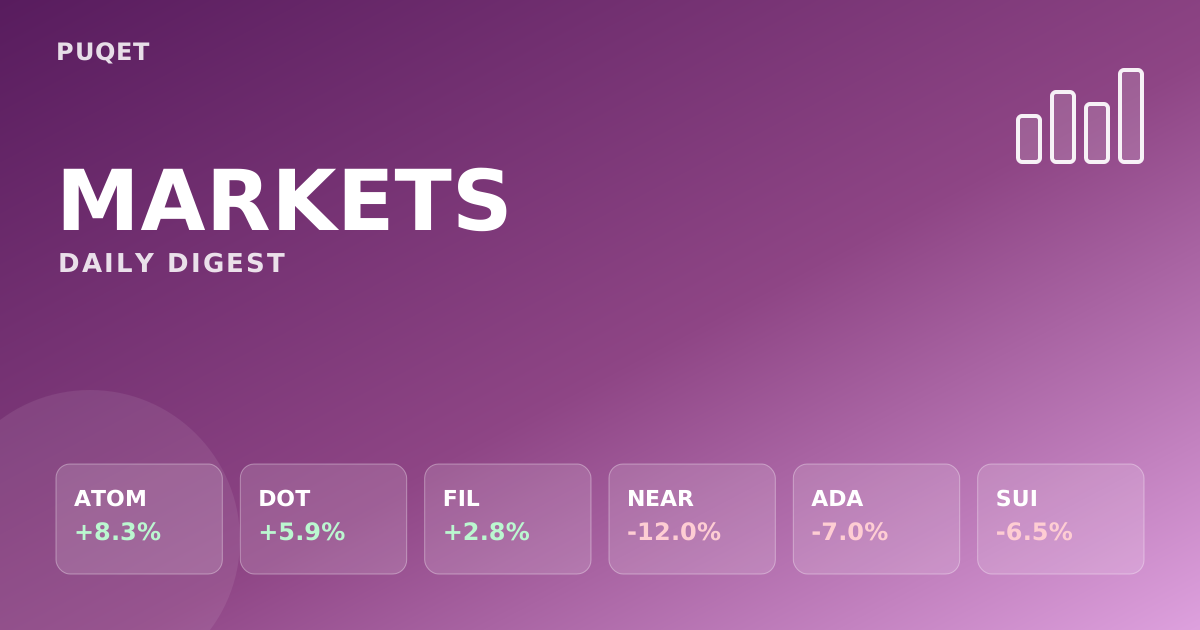
ATOM leads today's movers — see the full gainers and losers breakdown.
A moving average smooths out choppy price data into a single flowing line, helping chart readers see the underlying direction of a market. Here's how the calculation works, how simple and exponential versions differ, and what the line can and can't tell you.
Forex pairs are usually sorted into majors, minors and exotics. The labels aren't official — they describe how heavily traded a pair is, and that difference shows up in spreads, liquidity and how sharply prices can move.
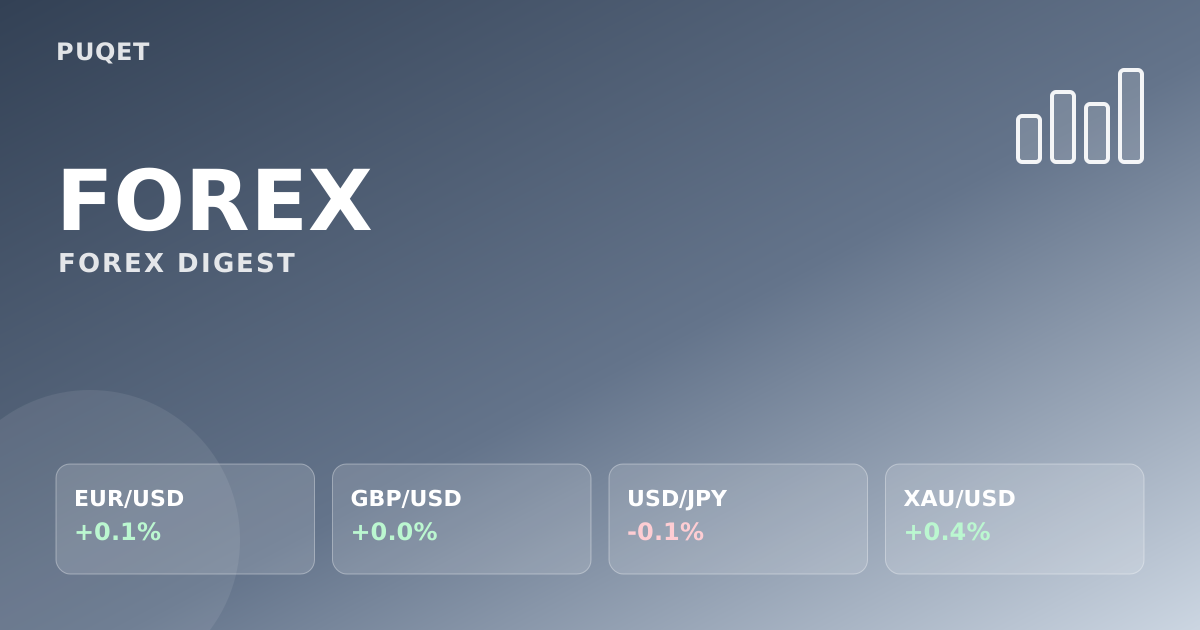
XAU/USD was the biggest mover over the last 24 hourly candles (+0.41%) — last price, change and range for each pair.
2026-10-08
NEAR leads today's movers — see the full gainers and losers breakdown.
Support and resistance are among the first concepts new traders encounter on a price chart. Here's what these levels actually represent, why they form, and what their real limits are.
Every forex quote has two prices, not one. Understanding the bid, the ask and the gap between them explains why a new trade often starts slightly underwater — and what makes that gap widen or narrow.
XAU/USD was the biggest mover over the last 24 hourly candles (-1.56%) — last price, change and range for each pair.
2026-10-07
RENDER leads today's movers — see the full gainers and losers breakdown.
Every crypto order book quotes one asset in terms of another. Learn how base and quote currencies work, why the same asset can have many pairs, and how to read the numbers.
Every forex price tags two currencies at once. Learn what the base and quote currency mean, how to read bid and ask prices, what a pip measures, and why gold quotes like XAU/USD follow exactly the same logic.
XAU/USD was the biggest mover over the last 24 hourly candles (+0.73%) — last price, change and range for each pair.
2026-10-06